- Climate
Study evaluates natural and human causes of recent rapid warming rate at the South Pole
Key takeaway
This statement accurately describes data analyzed in a recently published scientific study. As the article also explains, that study concluded that the temperature trend at this specific location was boosted by natural variability, and is not representative of the current human-caused climate change across Antarctica.
Reviewed content
Verdict:
Claim:
Surface air temperatures at the bottom of the world have risen three times faster than the global average since the 1990s.
Verdict detail
Accurate: Recorded temperatures at the South Pole weather station increased three times as much as the global average between 1989 and 2018. This is a statement about one station at the South Pole, specifically, and not broadly representative of global warming in Antarctica as a whole.
Full Claim
Surface air temperatures at the bottom of the world have risen three times faster than the global average since the 1990s[...] While the warming could be the result of natural climate change alone, the researchers said, it is likely that the effects of human-caused warming contributed to it.
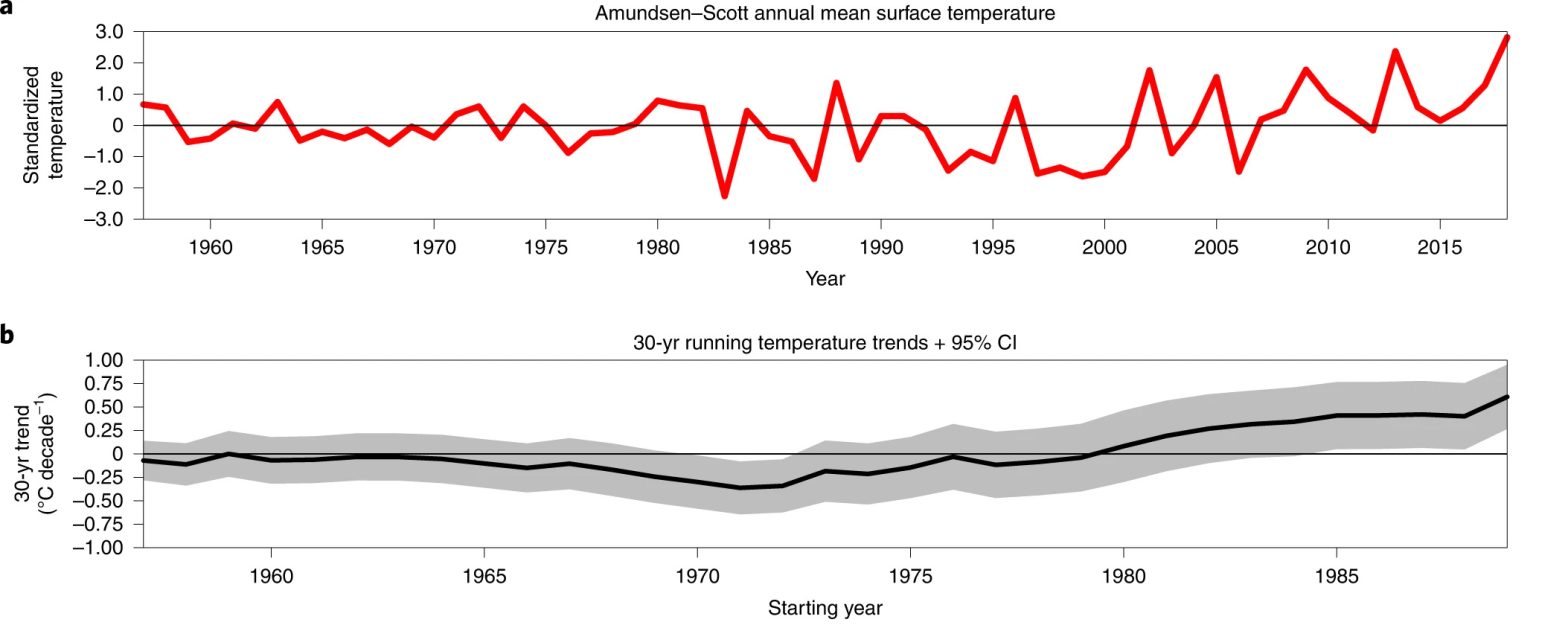
This statement is based on recent study published by Clem et al. in Nature Climate Change[1]. (The study’s first author also described it in an article for The Conversation.) The study analyzed temperature data from the Amundsen-Scott South Pole Station, and then analyzes Southern Hemisphere weather patterns to evaluate the causes of the recent warming rate.
Averaged over the 30-year period from 1989 to 2018, annual mean temperatures at the South Pole station have increased at a rate of about 0.61°C per decade.
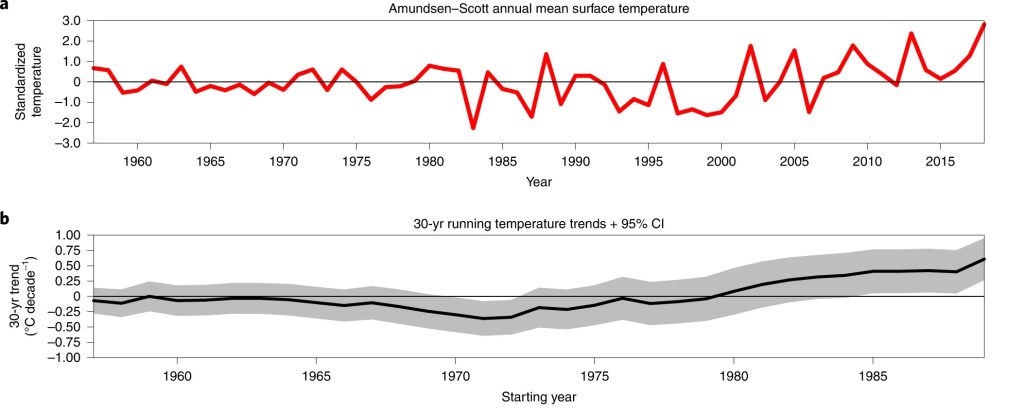
Over that same time period, global average surface temperatures have increased 0.6°C, equating to a rate of 0.2°C per decade. So it’s accurate to say that South Pole temperatures have increased at three times the global average.
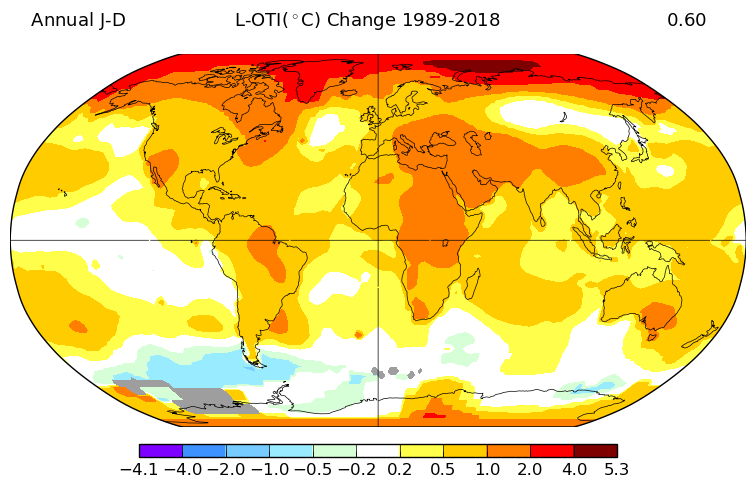
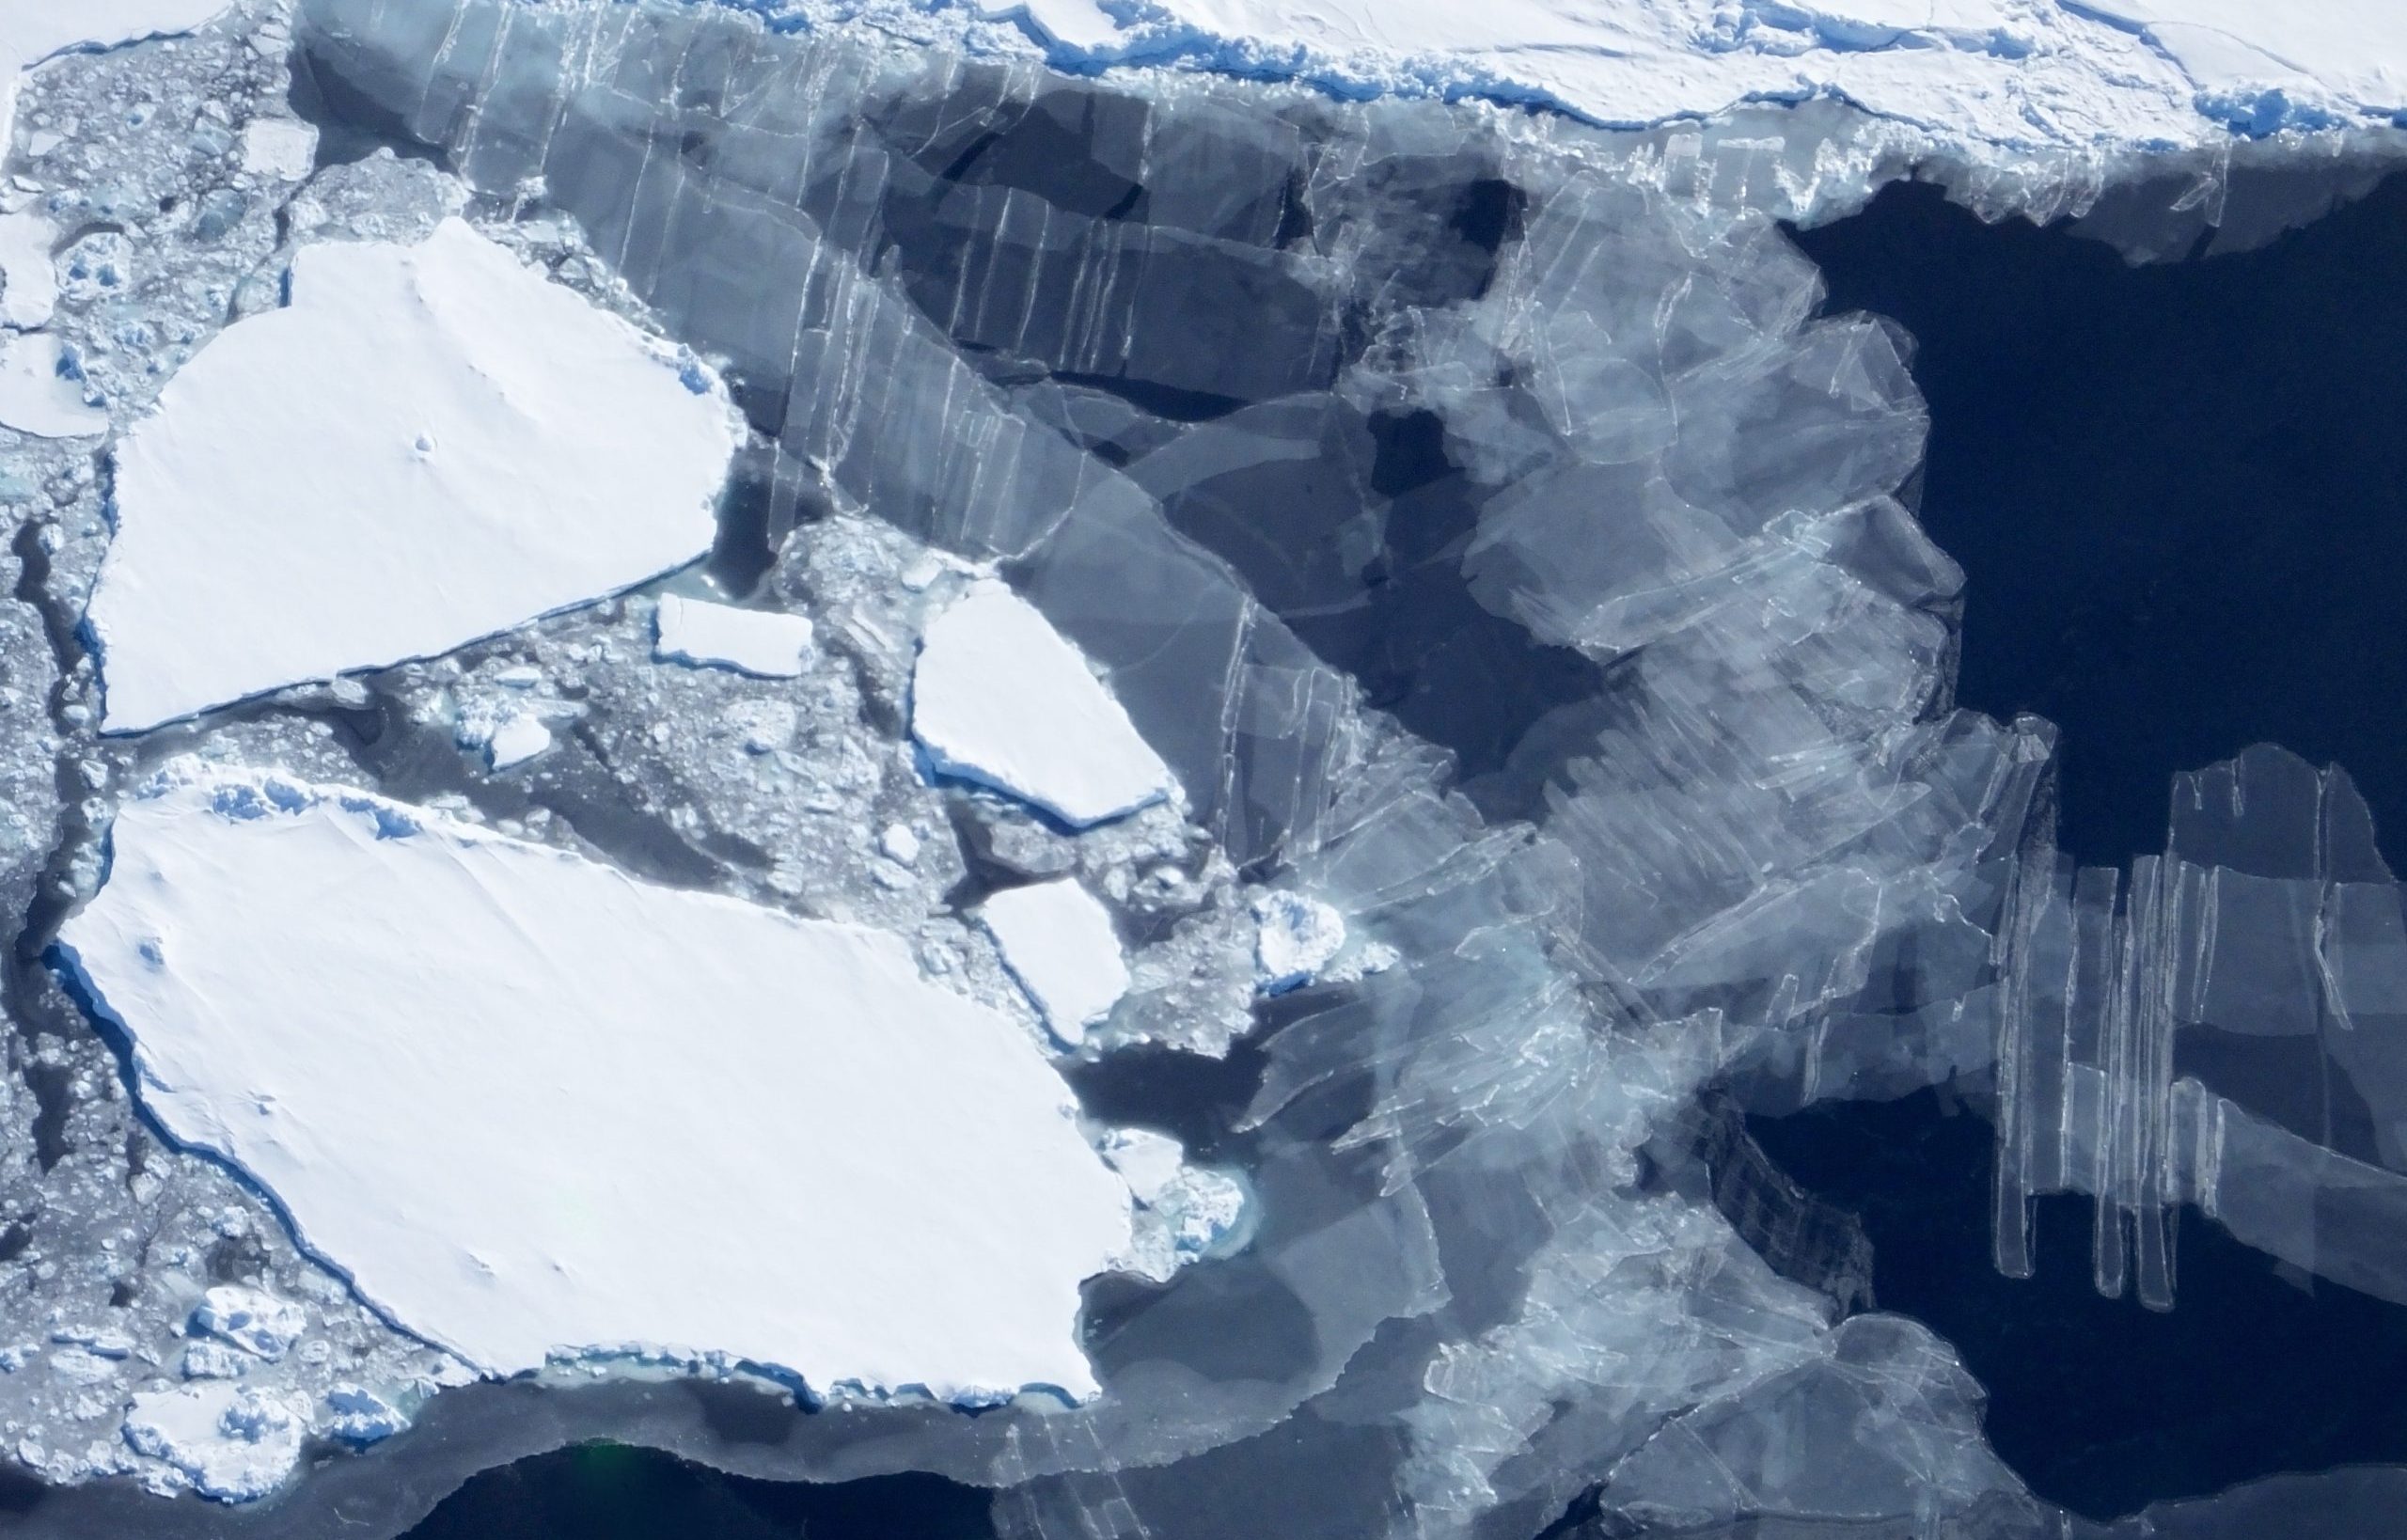
Source: NASA
But it’s important to note that this is a statement about the South Pole, specifically, and not broadly representative of Antarctica as a whole. As illustrated in the figure below, other Antarctic stations recorded a slower rate of warming, while others have even cooled over this time period. Unlike the Arctic, which has seen a widespread and rapid rate of warming, the Antarctic experiences particularly variable weather patterns. These are driven by natural oscillations of regional ocean surface temperatures and atmospheric circulation[2,3,4,5].
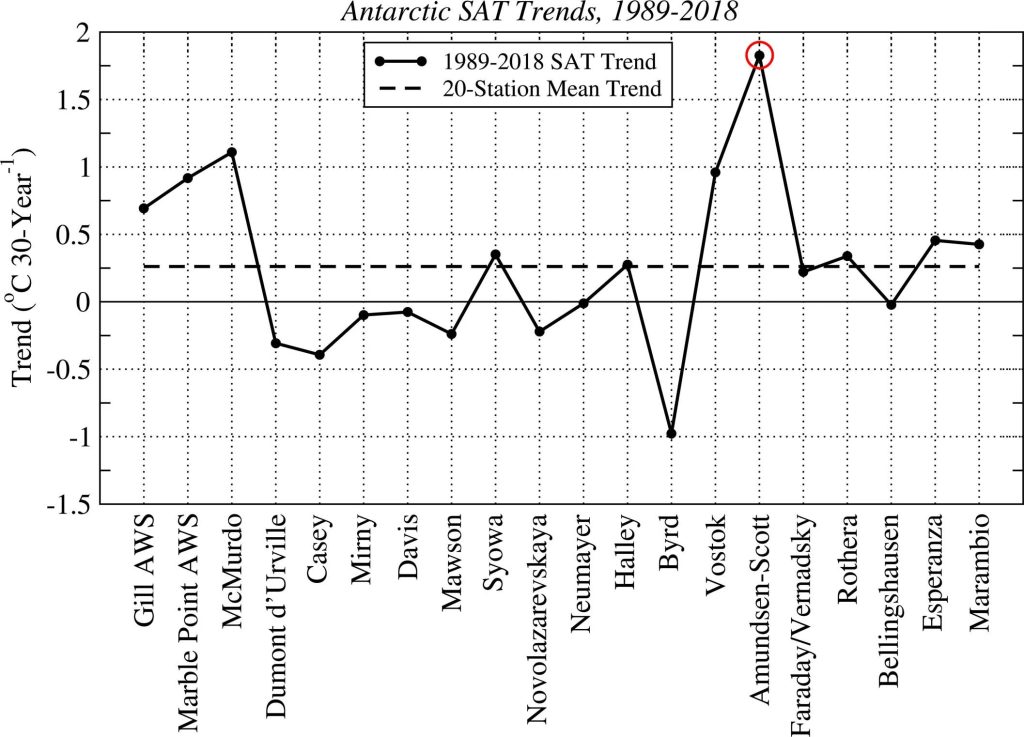
Source: Clem et al./Nature Climate Change
To understand why the South Pole station experienced such rapid warming in recent years, Clem et al.[1] analyzed wind patterns. They found that the last 30 years saw a higher frequency of winds from the warmer Weddell Sea rather than the colder interior of East Antarctica. In climate model simulations, they found that the observed trend is high compared to most simulated warming trends caused by human-caused greenhouse gas emissions.
Clem et al.[1] concludes that the South Pole station warming trend likely requires a significant contribution from natural variability. Specifically, they find a correlation between sea surface temperature patterns in the tropical Pacific Ocean and the wind pattern that brings warmer air to the South Pole. They write, “While radiative forcing from greenhouse gas increases probably intensified the recent South Pole warming, the observed trend remains within the upper bounds of natural variability inferred from unforced, pre-industrial simulations and can be explained via a strong cyclonic anomaly in the Weddell Sea resulting from coupling of negative [Interdecadal Pacific Oscillation] and positive [Southern Annular Mode] during the twenty-first century.”
REFERENCES
- 1- Clem et al. (2020) Record warming at the South Pole during the past three decades, Nature Climate Change
- 2- Simpkins et al. (2014) Tropical Connections to Climatic Change in the Extratropical Southern Hemisphere: The Role of Atlantic SST Trends, Journal of Climate
- 3- van der Broeke and van Lipzig (2003) Factors Controlling the Near-Surface Wind Field in Antarctica, Monthly Weather Review
- 4- Kowk and Comiso (2002) Spatial patterns of variability in Antarctic surface temperature: Connections to the Southern Hemisphere Annular Mode and the Southern Oscillation, Geophysical Research Letters
- 5- Marshall and Thompson (2016) The signatures of large‐scale patterns of atmospheric variability in Antarctic surface temperatures, JGR Atmospheres

