- Climate
Claims of a coming 30-year "mini ice age" are not supported by science
Key takeaway
Scientists cannot predict whether grand solar minimum, which is a decades-long period of lower solar activity, is coming. But even if one occurred, the consequences for average global temperatures would be minimal. Human-caused greenhouse gas emissions will continue to impact average temperatures much more strongly than solar activity cycles.
Reviewed content
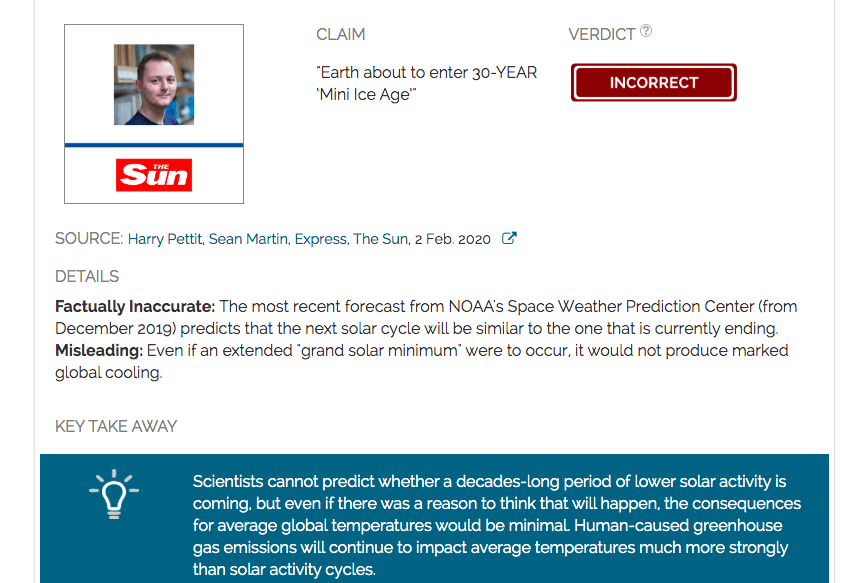
Verdict:
Claim:
Earth about to enter 30-YEAR ‘Mini Ice Age’
Verdict detail
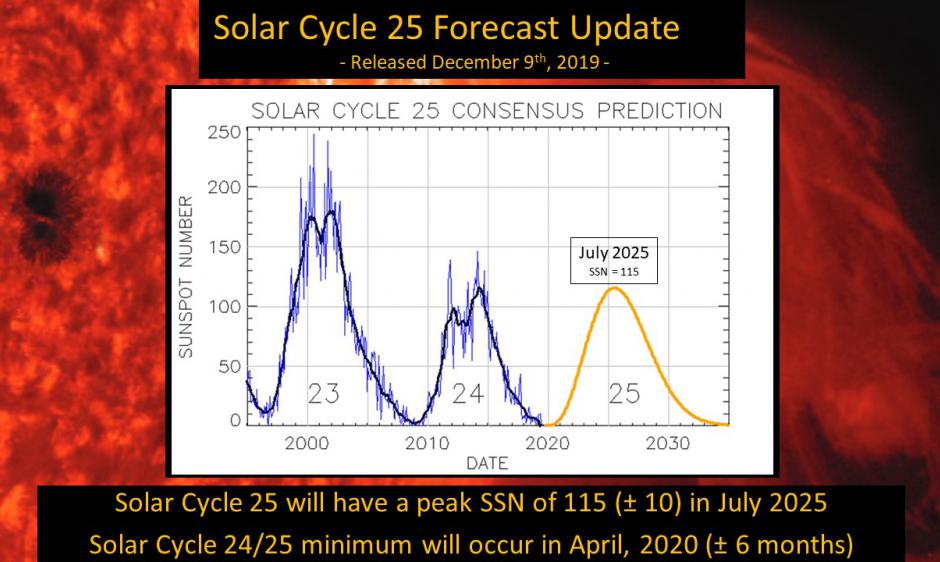
Factually Inaccurate: The most recent forecast from NOAA's Space Weather Prediction Center (from December 2019) predicts that the next solar cycle will be similar to the one that is currently ending.
Misleading: Even if an extended "grand solar minimum" were to occur, it would not produce marked global cooling.
Full Claim
EARTH could be braced for a ‘mini ICE-AGE' as experts warn a solar minimum could last until the 2050s. [...] According to Nasa, the Sun will reach its lowest activity in over 200 years in 2020.
UPDATE (12 Feb. 2020): The Sun has significantly rewritten this article, including changing the headline to “Claim that Earth will enter ‘mini Ice Age’ for 30 years is wrong, top scientists reveal“. It now reads, in part: “One researcher warned that the Sun entering a natural ‘hibernation’ would trigger food shortages and temperature slumps – but current data suggests this is completely untrue.”
While the article does not name or link to Climate Feedback’s review, it quotes from Doug Biesecker’s comment below. While some of the original article remains, the author has added qualifiers such as “While the Maunder Minimum occurred during a [grand solar minimum], most scientists think several factors contributed to the cold snap.“
Several articles repeat a claim (seen frequently at certain outlets like The Express) that a “mini ice age”, triggered by an extended period of unusually low solar activity is on the horizon. There are two problems with this claim: 1) the solar prediction does not reflect a consensus of scientists, and 2) an extended period of unusually low solar activity would not cause global cooling.
The claim of a coming “grand solar minimum” (a period during which several 11-year solar cycles in a row remain abnormally weak) in this article at The Sun seems to come from interpretations of a June 2019 NASA press release about a single study on the persistent 11-year cycle in solar activity. The press release states: “The forecast for the next solar cycle says it will be the weakest of the last 200 years. The maximum of this next cycle—measured in terms of sunspot number, a standard measure of solar activity level—could be 30 to 50% lower than the most recent one.”
The article containing the claim misstates this conclusion, writing that “the Sun will reach its lowest activity in over 200 years in 2020”. While the low point marking the end of the last solar cycle and the start of the next one will occur in 2020, the study did not conclude that the minimum point, specifically, would be the weakest. Rather, it was referring to the 11-year cycle as a whole.
More importantly, the most recent major solar cycle forecast came from NOAA’s Space Weather Prediction Center. This group periodically convenes an international panel of solar scientists to create consensus forecasts. The panel’s December 2019 forecast states that the upcoming solar cycle 25 “will be average in intensity and similar to Cycle 24”, which is the solar cycle ending in 2020.
As for the effects of an extended period of low solar activity on global temperatures, the article warns that it would cause a “mini ice age” and up to 1°C global cooling, a prediction that is attributed to Valentina Zharkova, an astrophysicist at Northumbria University who is quoted in virtually every “mini ice age” news story that gets published.
However, as explained in the scientists’ comments below, this does not accurately reflect the best understanding of climate science. The article containing this claim, like others before it, cites as evidence the Maunder Minimum, an approximately 70-year period of low solar activity beginning in the mid-1600s. The article claims that “temperatures plummeted across the globe” during this period. However, the cooler centuries around the Maunder Minimum were largely the result of major volcanic eruptions, not solar activity. The potential impact of a similar extended period of low solar activity is estimated to be only 0.1-0.2°C globally.
Doug Biesecker, Space Weather Prediction Center, NOAA:
[Dr. Biesecker was co-chair of NOAA’s Solar Cycle 25 Prediction Panel.]
There is no evidence we are headed into a grand minimum. With Cycle 25 predicted to be similar to Cycle 24 [2009-2020], we do not see anything approaching a grand minimum, at least not in the near future. What we cannot say is what Cycle 26 will look like—mainly because no one has a demonstrated method for predicting that far ahead.
As for solar minimum, the panel only addressed the timing of minimum, not the intensity. However, it would be fair to say that no one on the panel expects an extreme minimum. Based on the panel prediction of minimum occurring in April of 2020 (+/-6 months), we would expect this minimum to be very similar to the last minimum between Cycles 23 and 24.

Professor of Space Environment Physics, University of Reading
[This comment is taken from an evaluation of a similar statement.]
The Maunder minimum [mentioned in the article] was NOT (repeat NOT) a period of decades of freezing weather. It was a period when Europe had a higher fraction of cold winters but summers were, if anything, warmer in the Maunder minimum (as seen, for example, in the central England Temperature measurements) and paleoclimate data show a longer interval of slightly lower global temperatures (often massively misleadingly called the “little ice age”) which began long before the Maunder minimum and didn’t end until after the Maunder minimum was over. The idea that the Maunder minimum gave periods of unremitting cold is just wrong—it is often quoted but it is totally wrong.
The Figure below (from Owens et al paper1) shows any drop that could possibly be associated with the Maunder minimum is 0.2 °C (and Owes et al show that is not statistically significant).
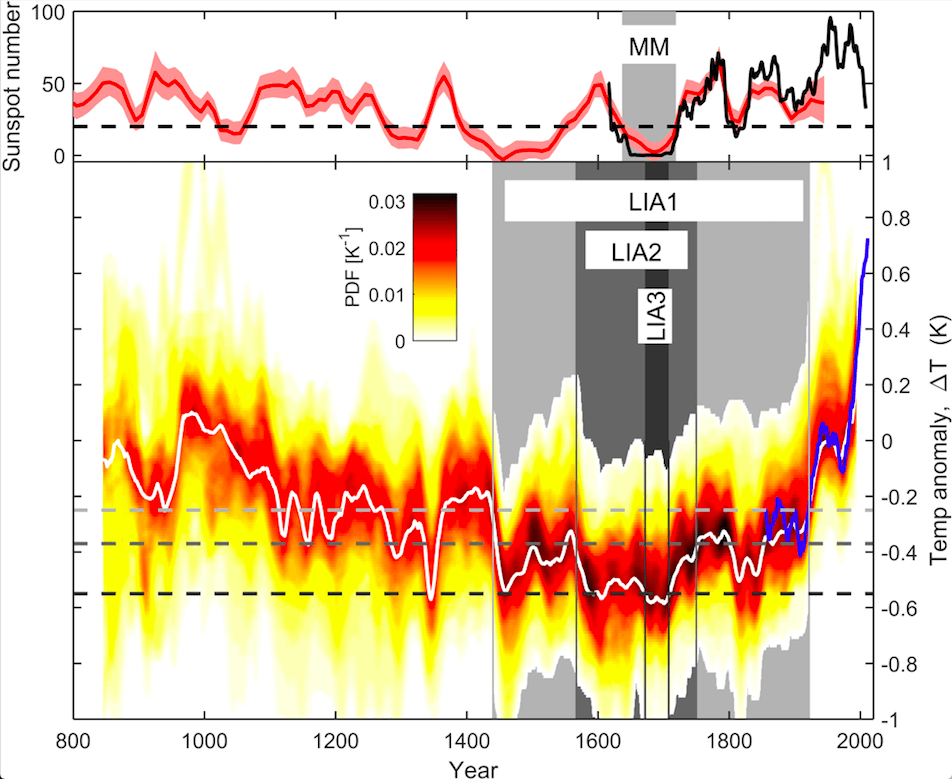
Figure – A comparison of solar activity and northern hemisphere climate from AD 800 to AD 2016. Top: Sunspot number, from direct telescopic observations (black) and reconstructed on the basis of 14C concentrations in tree trunks (red). Bottom: Northern hemisphere temperature anomaly, ΔT, (relative to the 1961–1990 mean) for paleoclimate reconstructions, as presented in the IPCC fifth assessment report. Colours, from white through red, show the probability density function (PDF), while the white line shows the PDF maximum value (or mode). The blue line shows ΔT from the instrumental record (HadCRUT4). (Source)
- 1- Owens et al (2017) The Maunder Minimum and the Little Ice Age: An update from recent reconstructions and climate simulations, Journal of Space Weather and Space Climate

Senior Scientist, Potsdam Institute for Climate Impact Research (PIK)
[This comment taken from an evaluation of a similar statement.]
While regional and seasonal effects might be larger, the expected global temperature response to a future grand solar minimum similar to the Maunder Minimum is a cooling of about 0.1°C. It should be pointed out that this cooling would occur on the background of current anthropogenic warming which is about a factor of 10 larger. To claim that temperatures will fall dramatically is thus not really justified. It is also clear from these numbers that a future grand solar minimum (which would last only for a few decades anyway) would not save us from global warming, as we have shown in a scientific paper and explained here. The marginal temperature differences between warming scenarios with and without a future Maunder Minimum is illustrated here:

Figure – Rise of global temperature for two different emission scenarios (A1B, red, and A2, magenta). The dashed lines show the slightly reduced warming in case a Maunder-like solar minimum should occur during the 21st century. The blue line represents global temperature data. Source: PIK.

