- Climate
Analysis of "Record-breaking climate change pushes world into ‘uncharted territory’"
Reviewed content
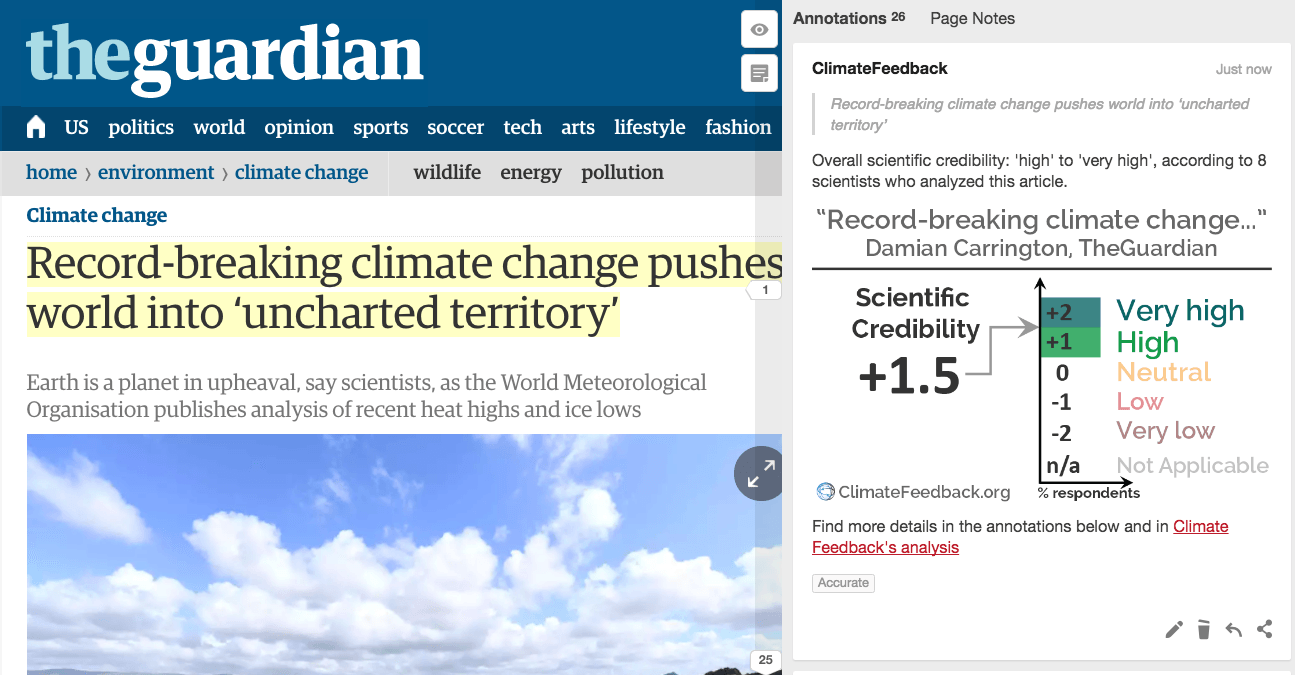
Published in The Guardian, by Damian Carrington, on 2017-03-20.
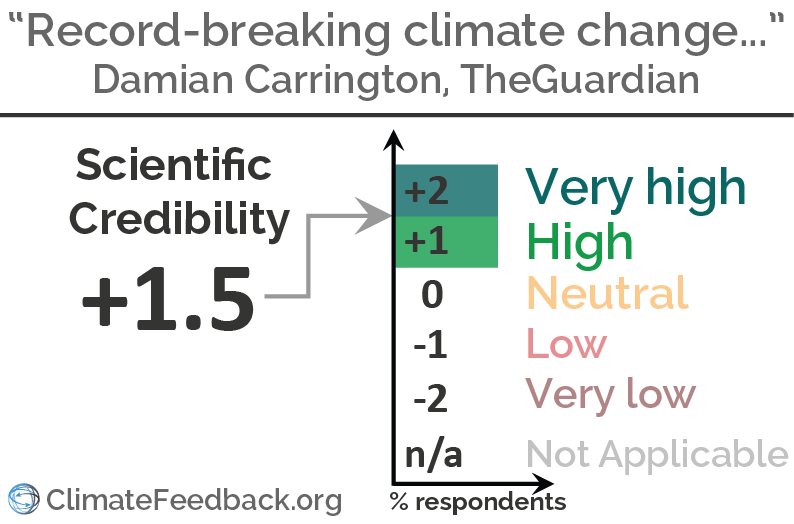
Scientists’ Feedback
SUMMARY
This article in The Guardian describes a “State of the Global Climate” report for 2016 recently released by the World Meteorological Organization (WMO). The report highlights observations of global temperature, sea ice extent, and sea level rise, as well as notable weather patterns.
Scientists who reviewed the article found that it accurately described climate trends and events mentioned in the WMO report, including record global warmth and notably low sea ice extents at both poles.
See all the scientists’ annotations in context
REVIEWERS’ OVERALL FEEDBACK
These comments are the overall opinion of scientists on the article, they are substantiated by their knowledge in the field and by the content of the analysis in the annotations on the article.

Professor, University of East Anglia, and Director of Research, Climatic Research Unit
Overall, this is an accurate and well-supported presentation of the significant nature of climate in 2016. I have highlighted a couple of statements that are overly confident/overstated, but most of the article is fine.

Research fellow, University of Melbourne
The article clearly and concisely documents some of 2016’s climate extremes and puts them in the context of the warming trend.

Climate Scientist, University of California, Los Angeles
Overall, the article accurately summarizes key points from the WMO report and places recent record-breaking climate events (such as unprecedented global heat and sea ice loss) into reasonable longer-term context.

Professor, Victoria University of Wellington
An excellent summary, mostly based on a report from the authoritative World Meteorological Organization. Some of the discussion (such as around sea level rise) cuts a few corners.

Postdoctoral Researcher, GFZ Helmholtz Centre Potsdam
In general, the article is scientifically accurate and does not misrepresent things, although to be critical, given the title and angle of the piece it might be better to focus more on observational data and measurements from 2017, rather than citing many observations from 2016. Another possible criticism is that the piece also relies heavily on quotes and opinions from scientists rather than objective datasets or new graphic representations of those datasets. There aren’t many of the measurements that the WMO have cited included in the report, for example.

Researcher, Royal Netherlands Institute for Sea Research (NIOZ)
I think the article gives an accurate view of the WMO report, and it refers to other sources/papers to support the claims.
Notes:
[1] See the rating guidelines used for article evaluations.
[2] Each evaluation is independent. Scientists’ comments are all published at the same time.
Key Take-aways
The statements quoted below are from the article; comments and replies are from the reviewers.
“Global warming is largely being driven by emissions from human activities, but a strong El Niño – a natural climate cycle – added to the heat in 2016.”

Professor, Victoria University of Wellington
Yes, as stated in the last IPCC report, human emissions of greenhouse gases have been the dominant driver of climate change since the mid-20th century. No other changes (such as the output of the Sun) can adequately explain the observed warming.
“But scientific research indicates the world was last this warm about 115,000 years ago and that the planet has not experienced such high levels of carbon dioxide in the atmosphere for 4m years.”

Professor, University of East Anglia, and Director of Research, Climatic Research Unit
This statement is overly confident and not based on a broad consensus in the literature. Even the cited study states “we cannot be certain that the current year is warmer than any single year earlier in the Holocene due to centennial smoothing of the Holocene stack and original resolution of the underlying proxy records”. The most recent IPCC assessment indicates only moderate confidence that 1983-2012 was the warmest 30-year period in the last 1,400 years and limited this to the Northern Hemisphere rather than the global average.

Postdoctoral Researcher, GFZ Helmholtz Centre Potsdam
Actually, some of the more recent estimates* have suggested that we may have crossed over the 400 ppm threshold briefly as recently as 2.4 million years ago, and again at 2.9 million years ago. (see Martinez-Boti et al.*). I think climate scientists typically think of the Pliocene (between about 5.3 and 2.6 million years ago) as being the last time period where CO2 may have been more or less permanently above the 400 ppm threshold though, so perhaps this is what they are referring to here. It might be advisable to tidy up the terminology a little here nonetheless.
- Martinez-Boti et al (2015), Plio-Pleistocene climate sensitivity evaluated using high-resolution CO2 records, Nature

Professor, Victoria University of Wellington
At the last interglacial period 115,000 years ago, increased solar intensity was responsible for the added warmth, but today’s high CO2 was last seen in the atmosphere 3-5 million years ago. At that time, global mean temperatures were a couple of degrees higher than present, and sea levels were several metres higher than present.
“‘With levels of carbon dioxide in the atmosphere consistently breaking new records, the influence of human activities on the climate system has become more and more evident,’ said Taalas.”

Professor, Sr. Research, Oregon State University
Readers should also be aware of the decades-long lag between the stabilization of CO2 in the atmosphere and the stabilization of CO2-induced warming. The planet will continue to heat because ocean temperatures will not yet be in equilibrium with the atmosphere.
“El Niño is now waning, but the extremes continue to be seen, with temperature records tumbling in the US in February and polar heatwaves pushing ice cover to new lows.”

Research fellow, University of Melbourne
The El Niño pattern of sea surface temperatures waned quite a long time ago, with neutral conditions by mid-2016. The effects of the El Niño on the atmosphere persisted through the year, though.

Climate Scientist, University of California, Los Angeles
The fact that numerous high temperature and low sea ice records are still being exceeded in 2017, despite the lack of El Niño conditions in the Pacific Ocean, is indeed a testament to the increasingly strong human fingerprint upon global weather and climate events.

Professor, Victoria University of Wellington
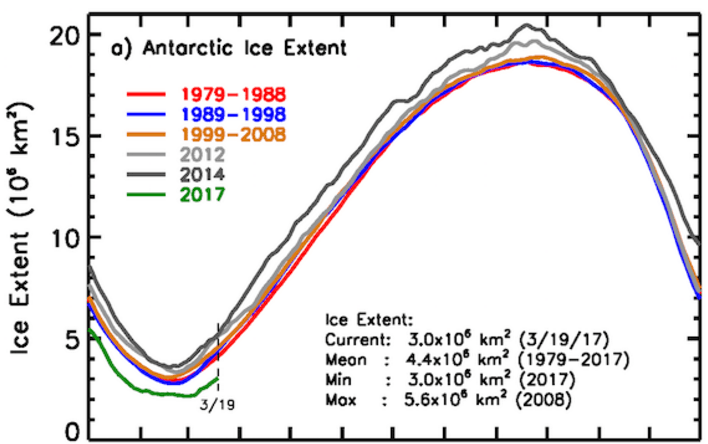
This is especially striking in the Antarctic where sea ice extent has been increasing gradually for many years. We are now seeing historic lows in sea ice extent.

Researcher, Royal Netherlands Institute for Sea Research (NIOZ)
Decreasing sea ice extent has been mostly observed in the Arctic, but now also the Antarctic is showing declining sea ice extent. See this page for up to date observed sea ice extent and area.
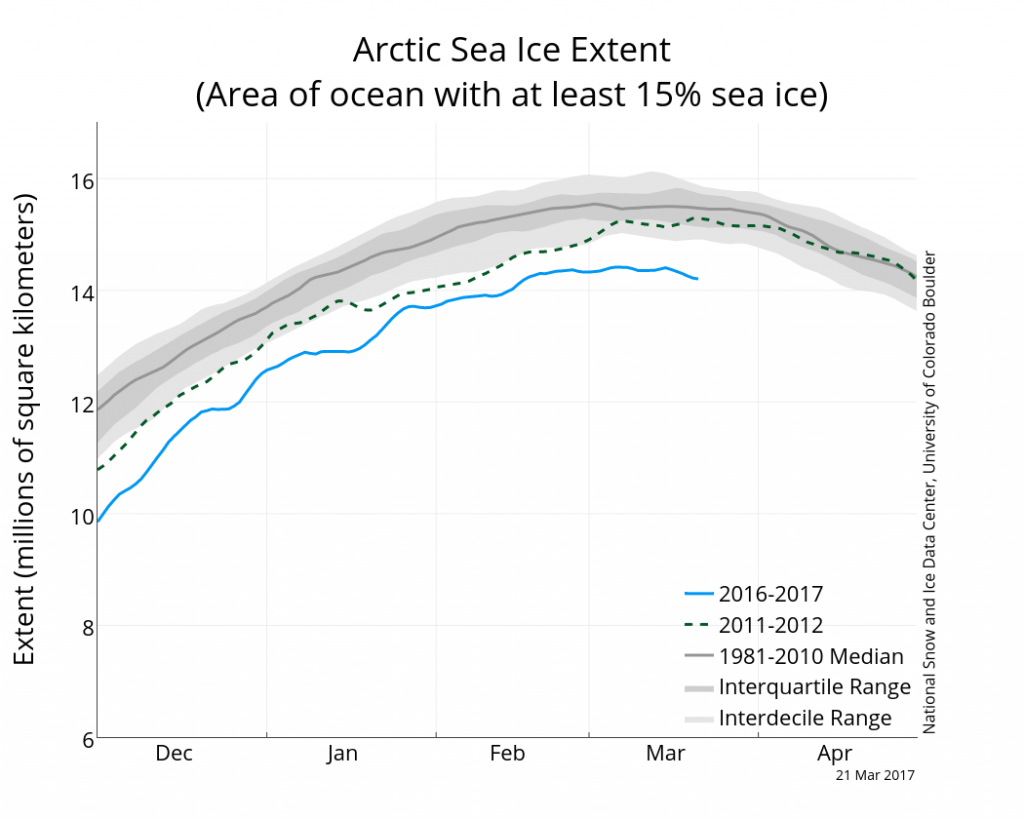
“‘Arctic ice conditions have been tracking at record low conditions since October, persisting for six consecutive months’”

Professor, University of East Anglia, and Director of Research, Climatic Research Unit
Yes, this is supported by the observations, available at the NSIDC website.
“‘The Arctic may be remote, but changes that occur there directly affect us. The melting of the Greenland ice sheet is already contributing significantly to sea level rise, and new research is highlighting that the melting of Arctic sea ice can alter weather conditions across Europe, Asia and North America.’”

Climate Scientist, University of California, Los Angeles
There is indeed observational evidence that melting of the Greenland ice sheet, which contributes to global sea level rise, has accelerated in recent years. While scientists are still intensively investigating the details, it is also true that recent research* suggests that the loss of Arctic sea ice will mostly likely influence weather patterns in mid-latitude regions (including much of Europe, Asia, and North America).
- Screen (2017) Far-flung effects of Arctic warming, Nature Geoscience
“The WMO’s assessment of the climate in 2016, published on Tuesday, reports unprecedented heat across the globe, exceptionally low ice at both poles and surging sea-level rise.”

Professor, University of East Anglia, and Director of Research, Climatic Research Unit
“Surging” suggests that the faster sea level rise in 2016 has continued, whereas the surge was between Nov 2014 and Feb 2016, as indicated in WMO’s statement and in the data.
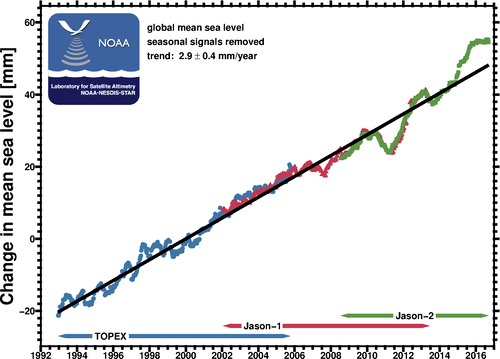
“Global sea level rise surged between November 2014 and February 2016, with the El Niño event helping the oceans rise by 15mm.”

Professor, Victoria University of Wellington
A large part of this rise is related to the transition from La Niña to El Niño. The background rate of global sea level rise is still between 3-4mm per year.
“Final data for 2016 sea level rise have yet to be published.”

Researcher, Royal Netherlands Institute for Sea Research (NIOZ)
Agreed, and the causes and reasons will need to be disentangled (El Niño/anthropogenic/other; ice/ocean/other). The total global mean sea-level record is publicly available through NASA’s website.
“For example, the Arctic heatwaves are made tens of times more likely and the soaring temperatures seen in Australia in February were made twice as likely.”

Research fellow, University of Melbourne
This statement is referring to rapid attribution analyses that were conducted by the World Weather Attribution group.
We found that the Arctic heat of late 2016 was made much more likely by human-induced climate change (although it remains a very unusual event in the current climate).
In another analysis, we found the February heatwave in New South Wales was at least twice as likely to occur because of climate change.
“‘Continued investment in climate research and observations is vital if our scientific knowledge is to keep pace with the rapid rate of climate change.’”

Professor, Victoria University of Wellington
Correct. We are learning as we go, observing how the climate is changing, but more effort is required to keep up with changes and to understand the physical processes at play.
“Our children and grandchildren will look back on the climate deniers and ask how they could have sacrificed the planet for the sake of cheap fossil fuel energy, when the cost of inaction exceeds the cost of a transition to a low-carbon economy,’ Watson said.”
There are large uncertainties surrounding the cost of inaction (i.e., what would be the monetary consequences of adapting to climate change were we not to mitigate its causes and keep emitting as we are doing today). Some of the physical impacts are estimated through projections which may be imperfect. There is large disagreement about what discount rate to use to value future climate damages1. Many of the consequences are simply hard to translate in monetary terms (non-market impacts). Some of the impacts may be nonlinear. This has lead multiple authors to consider abatement as a valuable tail-hedge insurance investment2,3.
- 1. Heal and Millner (2014) Agreeing to disagree on climate policy, PNAS
- 2. Weitzman (2014) Fat Tails and the Social Cost of Carbon, American Economic Review
- 3. Drouet, Bosetti, and Tavoni (2015) Selection of climate policies under the uncertainties in the Fifth Assessment Report of the IPCC, Nature Climate Change

